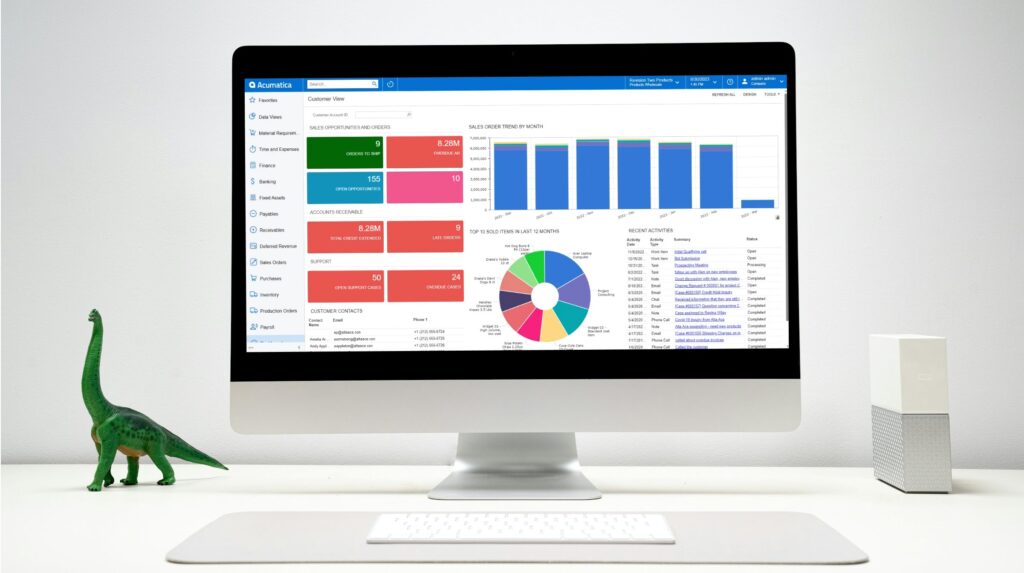
Accounting departments that struggle with managing a mess of multiple AP (Accounts Payable) and AR (Accounts Receivable) tasks and workflows can leverage the pre-built dashboards in Acumatica Cloud ERP to make reporting easier. These views are preconfigured to provide your team with insight into each activity, with a customized screen already set up for their account when they log in. Each tile and chart on that screen is live data and each one drills directly to the source record.
Drawing on the training resources compiled by the expert consultants at SWK Technologies, this article walks you through the out-of-the-box AP and AR clerk dashboards in Acumatica, the reporting workflow that pairs with them and the design controls that let your team adjust either dashboard in-house:
What an Acumatica Dashboard Does for You
An Acumatica dashboard is a single-page workspace built from widgets — tiles, charts, data tables, KPI scorecards, trend cards and embedded content — that draw their data from Generic Inquiries running in the background. The data refreshes in real time, every widget is clickable and the entire view is mobile-ready. Administrators assign a dashboard as a user’s homepage through that user’s record, so an AP clerk who logs in sees their view and an AR clerk sees their own view without choosing one manually.
Acumatica AP Clerk Dashboard Template
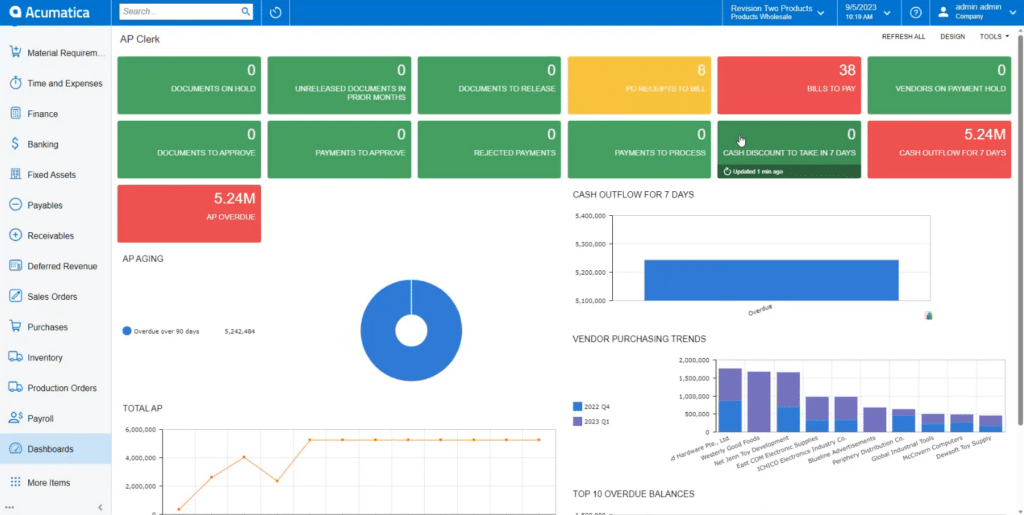
The out-of-box AP clerk dashboard ships as a preconfigured role view template in Acumatica. The top of the screen carries KPI tiles for high-level monitoring and the lower portion carries charts that track AP performance over time.
AP Dashboard KPI Tiles
The default tile set covers overdue payables, bills to pay, receipts to bill, documents on hold and similar AP-specific metrics. Each tile shows a current value pulled from live data, so a clerk who opens the dashboard at the start of the day sees the actual count of bills waiting to be paid rather than a snapshot from the prior reporting cycle. Tiles are clickable and clicking one opens a new tab listing the underlying records.
Charts for Trend Visibility
Below the tiles, the dashboard carries charts for cash outflow, total accounts payable and overdue balances. The cash outflow bar graph and the total AP line graph give clerks a longer view than the tiles alone, which is useful when a manager asks why this month looks different from last. Each chart is configurable, so the dataset behind it can be adjusted without leaving the dashboard.
Drilling from a Tile to a Bill
Clicking an overdue payables tile opens a tab listing every vendor with an outstanding balance, sorted alphabetically by default and adjustable like a spreadsheet. Clicking a vendor opens that vendor’s record with each outstanding bill shown by reference number, due date and balance due. Clicking a reference number opens the bill itself, where the clerk can review line items or process payment without backing out to a menu.
Acumatica AR Clerk Dashboard Template
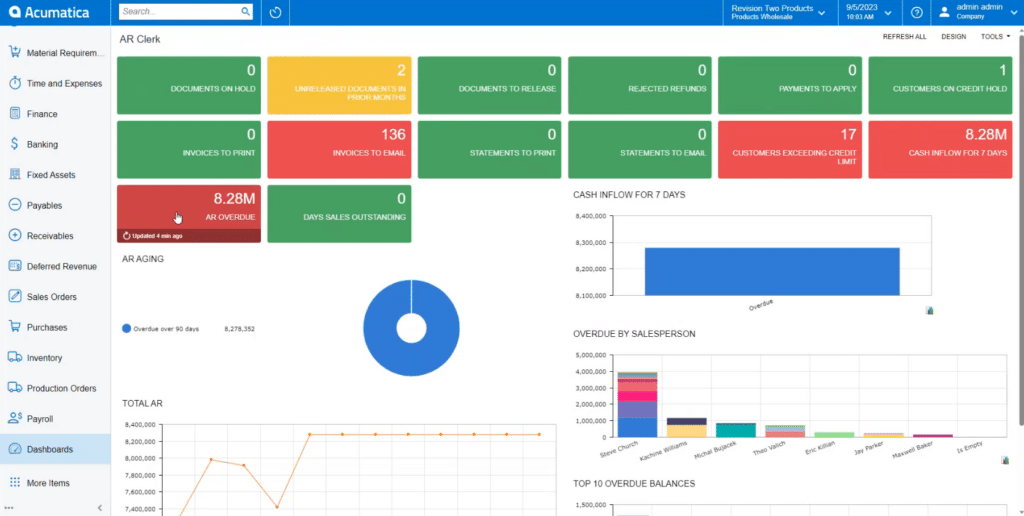
The AR clerk dashboard template follows the same pattern as the AP version, with preconfigured tiles and charts included out-of-the-box.
AR Dashboard KPI Tiles
The default AR tile set covers overdue receivables, customers over the credit limit, unreleased documents in prior months and invoices ready to print. The credit-limit tile and the prior-month unreleased documents tile carry particular weight, because both flag conditions that block a clean period close. As with AP, every tile is a live count drawn from the underlying data.
Charts for Cash Inflow and Aging
The lower section of the AR dashboard carries an aging doughnut chart, cash inflow bars, an overdue balance chart and a total AR line graph. The aging chart and the overdue balance chart cover similar ground from different angles — the doughnut shows the distribution across aging buckets and the bar chart shows the dollar amount of each bucket against the others.
Drilling from a Tile to a Customer Invoice
Clicking the overdue receivables tile opens a tab listing every customer with a past-due balance, the overdue amount, the total balance and the contact information. Clicking a customer opens that customer’s record with each outstanding invoice listed. Clicking an invoice opens the source document, where the clerk can see the services billed, the financial detail and the journal batch behind the entry.
Running AP and AR Reports from the Module Menu
Dashboards monitor the current state of the books. Reports under the Payables and Receivables modules document that state for distribution and audit. Each module’s Reports section carries standard outputs — AP Balance by Vendor, AP Aging, AR Balance by Customer, AR Aging — that share a common form: report format, company and branch and financial period. After the report runs, every reference number on the output is a hyperlink back to the source bill or invoice, so a clerk reviewing an aging report can drill into a specific record without leaving the report view.
Distributing Reports
Each generated report can be printed directly, exported to Excel or PDF or sent by email through a form that auto-attaches the PDF before the clerk addresses the message. The email path is the one most clerks use in practice, because it removes the download-then-attach step that creates filing inconsistencies when several people on the team distribute the same report at different times.
Customizing the Dashboard in Design Mode
Acumatica’s design mode is the in-house customization layer for any dashboard. Clicking Design enables copy, edit and delete controls on every widget, exposes drag-and-drop placement for rearranging tiles and charts and adds a layout selector for changing the column split across the screen. New widgets can be added from a catalog that includes charts, data tables, pivot tables, KPI scorecards, trend cards, header tiles and embedded content. A clerk with appropriate permissions can adjust the layout without involving SWK or Acumatica directly, which keeps the dashboard responsive to how the team actually works rather than how it worked at go-live.
Get More from Acumatica Cloud ERP with SWK Technologies
Getting the most out of these views — and out of the Generic Inquiries and reports behind them — depends on configuring the system to match how your finance team actually works. SWK Technologies has helped businesses across multiple industries implement and customize Acumatica successfully – get in touch with our team of experts today to see firsthand how we can empower your team to get the most out of your ERP.
Contact SWK here to talk through how Acumatica dashboards can fit your accounting team’s needs and discover how we can help you capture peace of mind over your reporting.