Ready to see a demo of Sage 100? Click here.
This Is Your In-Depth Walkthrough for Using Power BI with Sage 100
Gaining insight into your company’s performance is a critical step on the path to becoming agile. Using business intelligence (BI) tools can help deliver the in-depth insight organizations need to succeed. However, leading BI tools such as DataSelf or Nectari are built with the needs (and budget) of midsize companies in mind. How can growing businesses achieve the business intelligence-driven insight they need without a midsized company’s budget?
Enter Power BI.
If you have been curious about how you can use Power BI with Sage 100 to enhance your insight into business performance, this is the webinar for you. This in-depth walkthrough shows you every step it takes to connect your Sage 100 data to Power BI, build visualizations, and start using them.
Watch the webinar now.
Skip to the Sections that Matter to You!
This webinar features SWK’s Sage 100 Project Manager, Bruce Kern, who provides a step-by-step guide that helps you understand how to use Power BI and set up your own visualizations.
Looking for specific information? Use this summary to skip forward to the parts that interest you. Timestamp information is located to the right of each item. Please select that time when you are watching the video:
Why Power BI Matters
Power BI is a Microsoft application, like Excel or Word, that provides familiar tools you can use to build data visualizations so you can slice, dice, extract, or filter your Sage 100 data with ease. Of course, Power BI works with any data you want to connect to it but, as a Sage 100 expert, SWK’s Bruce Kern is most interested in talking about how you can use Power BI with Sage 100.
- Gain an overview of business intelligence (2:29)
- Understand the big picture of what data you can connect to Power BI (4:00)
- View the flow of Power BI – how it moves through the stages of data publication (5:16)
In addition to being easy to use and a product that typically comes with your Microsoft 365 tools, Power BI has a lot of free, online resources available like this one, which you can use to become a Power BI expert.
- Why do small businesses benefit from using Power BI? (6:18)
- Understand how licenses work for Power BI (8:50)
Why Use Power BI with Sage 100 Premium?
In this video, Bruce focuses on Sage 100 Premium, though he also provides helpful tips for companies using Sage 100 Standard and Advanced. The reason why he focuses on Sage 100 Premium is because it is the only Sage 100 product that works with SQL Server.
- What is SQL Server? (10:58)
- See an actual SQL Server and understand how to access your own (11:15)
- Define the term “Direct Query” – this is important! (11:46)
Step 1: How to Connect Your Data
The beauty of Power BI is that it helps you access your Sage 100 data without having to use Excel export/import as a staging ground. You can directly connect your Sage data to Power BI and, with SQL Server and Sage 100 Premium, this makes it possible for you to see nearly real-time updates to your data – all using a tool you already own!
- How to connect your Sage 100 data to Power BI (14:33)
- Tip: What data sources can Power BI connect to? (15:13)
- The difference between importing data and Direct Query (16:25)
- How to connect to SQL Server and connect your data from tables (17:40)
- How to create a relationship between your tables (20:07)
- Tip: Learn how Power BI uses logic to help with this process (20:50)
- How to visually adjust relationship tables, so you can see their connections (21:46)
- How a Power BI file saves (22:35)
Using Sage 100 Standard or Advanced? Although this video focuses on using Power BI for Sage 100 Premium with SQL Server, Bruce provides helpful tips throughout the webinar for Sage 100 Standard and Advanced users.
- How to connect Power BI to Sage 100 Standard or Advanced (15:45)
- Various workarounds for Sage 100 Standard and Advanced (17:08)
- What happens with cached data if you’re using Sage 100 Standard or Advanced? (19:21)
Step 2: How to Build a Model
“Modeling” is a term that is used across all data visualization applications and services. Although the term can sound intimidating, all it refers to is the way the data should be displayed for you to use it. For example, you wouldn’t want your Sage 100 data to display as percentages or fractions, you would want it to display as whole numbers and decimals so you can do math with it.
In this section, Bruce demonstrates how you can start building your own data models.
- How to open and use the Power Query Editor (23:46)
- 4 examples of how you can tweak your data (24:33)
- How to restructure table content (25:21)
- Tip: See how Power BI tracks the changes you make to your data models (26:14)
- How to rename fields (26:26)
- How to add custom columns (26:51)
- Tip: What is DAX syntax? (27:19)
- How to set the data type, such as decimals or whole numbers (28:34)
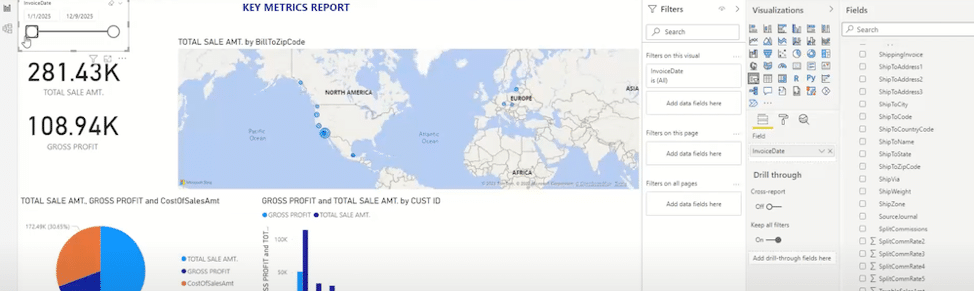
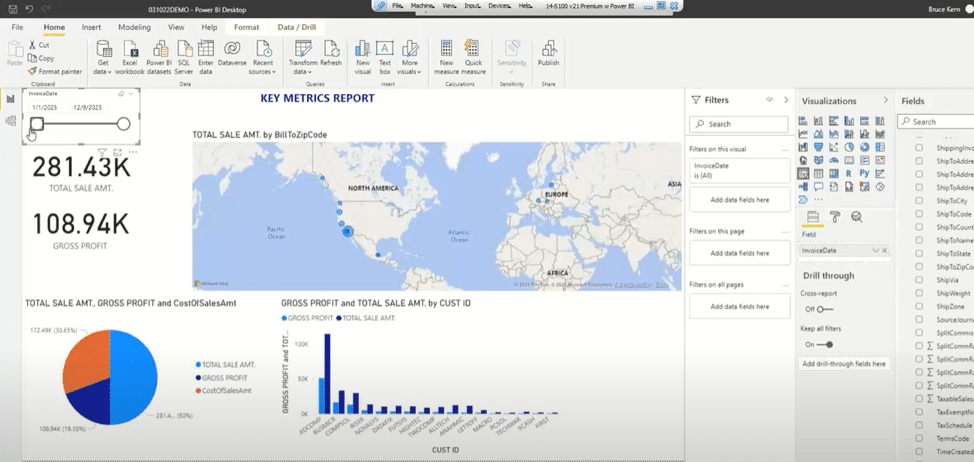
Step 3: How to Build Visualizations
Once you see Power BI in action, you will most likely breathe a sigh of relief. It looks a lot like PowerPoint – so you already know how to start building attractive visualizations. Here, Bruce explains the tools Power BI places at your disposal.
- Slicers (33:36)
- Cards (35:08)
- Tip: Another way to build using drag and drop (35:30)
- Pie charts (36:41)
- Tip: Don’t let this common issue frustrate you (36:42)
- Clustered column charts (37:58)
- Maps (39:12)
- Adding pages (41:01)
- Tip: Build better visualizations by understanding how Sage tracks customers (41:57)
- How quickly does Sage 100 data update in Power BI? (43:19)
Sometimes an overview of your data makes sense, but usually you want to be able to drill into your data to understand the numbers behind the numbers. Power BI with Sage 100 provides you with ample drilldown functionality.
- How to build a drilldown (44:56)
- Tip: What are drilldown hierarchies? (46:17)
- The drilldown icons (47:05)
- How to drill into a specific bar on a chart (47:27)
- How to drill into an entire chart (48:28)
- How does the slicer work? (49:20)
For Sage 100 Standard and Advanced users:
- Why is cached data different from Direct Query data? (49:53)
Step 4: How to Publish Your Visualizations to the Power BI Service
Power BI has two components: the desktop app is where you build your visualizations, but the Power BI service online is where you view your visualizations. This makes it easy to share visualizations with other stakeholders.
- What is a workspace? (50:49)
- What’s available in the Power BI service online? (51:58)
- What are datasets? (53:26)
- Navigating the My Workspaces tab (54:09)
- Tip: What do the icons mean? (54:33)
- How to share visualizations (55:03)
Step 5: How to Keep Your Data Synced
Since you are using Power BI with Sage 100 data to analyze ongoing business performance, you will want to ensure that your published Power BI visualizations contain up-to-date data. To do this, you will need to create a gateway connectionbetween the Power BI service and where your data resides in Sage 100.
- Using the gateway function (55:43)
- Tip: Understand 2 types of gateways (56:35)
- See how fast a gateway works (1:00:06)
Step 6: How to Build Dashboards
A dashboard is a collection of related data that displays on a single page. These relations could be objective and follow a single theme such as sales data, or they could subjectively help you do your job by gathering all the items you watch over onto a single screen. However you use them, dashboards are a great way to keep an eye on performance. Plus, they’re easy to build.
- What are dashboards? (1:02:20)
- How to add visualizations to a dashboard in Power BI service (1:02:57)
- How to drilldown to supporting data from a dashboard (1:03:40)
Extend Your Learning
This in-depth walkthrough on how you can start using Power BI to analyze your Sage 100 data was only one of the many free, in-depth webinars SWK Technologies offers to help you do more with your technology.
If you liked this video and you want to watch more in-depth webinars that will help you use your business tech to drive success, please check out our upcoming events and webinars.
In the meantime, please bookmark this webinar link so you can return to the information whenever you need it.
Watch the “Power BI 101 for Sage 100” webinar now.
For more than 30 years, SWK Technologies has been helping SMBs get more out of their mission-critical technology with targeted, smart solutions that make it easier to handle financials and make faster, better business decisions. Curious to learn more? We are always happy to introduce you to the options that can help you increase agility and drive business performance. Get in touch using the form below. We will get back to you soon!
Talk to the financial software experts at SWK